Data Analytics Technology

Data Analytics Technology, Knowledge Base

Power BI Pro vs Premium vs Fabric

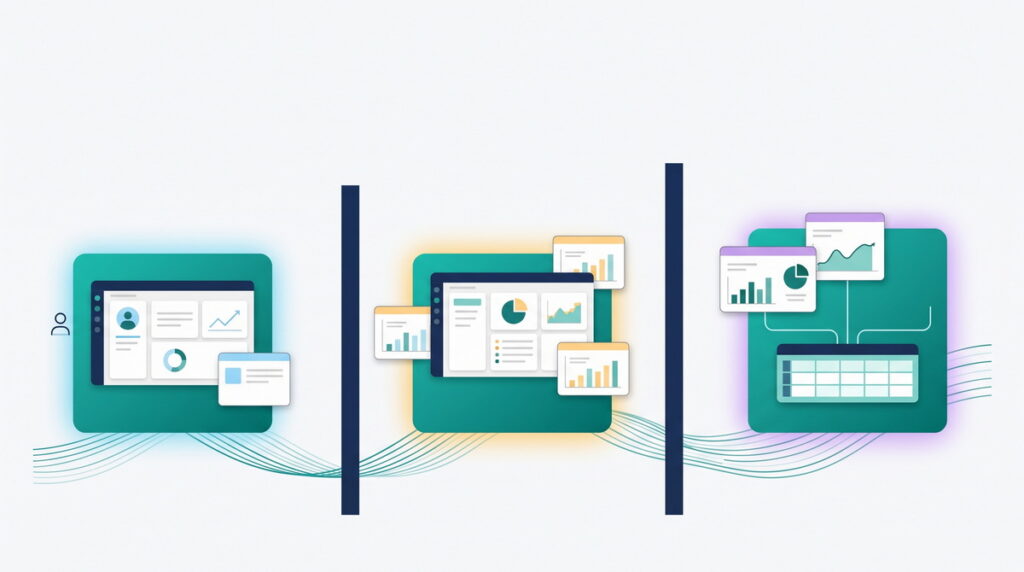
Power BI licensing confuses almost everyone, and for good reason: the tiers overlap, the names have changed, and the pricing pages leave out the numbers that decide the choice. The good news is that the right license comes down to three simple things: who creates reports, who views them, and how many of each there are. This guide explains the tiers, what each costs, and how to pick the one that fits without overpaying.

Data Analytics Technology, Knowledge Base

Lakehouse vs Warehouse in Microsoft Fabric 

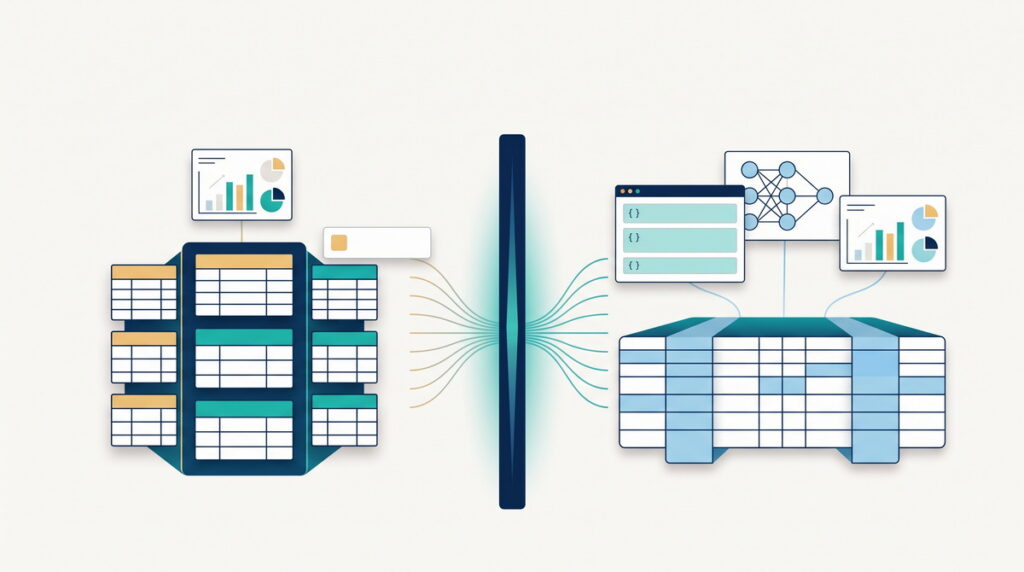
Microsoft Fabric gives you two ways to store and query structured data: a lakehouse and a warehouse. They look similar from a distance, both hold tables, both answer SQL, both feed Power BI, and that resemblance is exactly what makes the choice confusing. The good news is that the decision comes down to a few clear questions about your data and your team. This guide explains what each one is, how they differ, and how to pick the one that fits.

Data Analytics Technology, Knowledge Base

Why BI Projects Fail

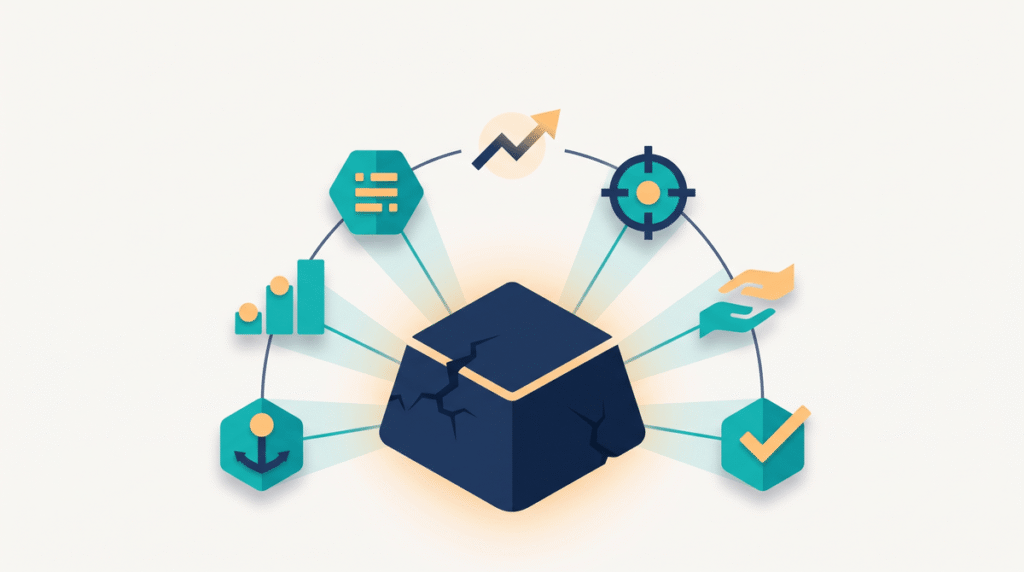
Most business intelligence projects don’t deliver what they promised. Dashboards get built, launched, and then slowly abandoned, and the decisions they were meant to improve keep getting made on gut feel. The reasons are remarkably consistent, and remarkably rarely about the technology. This guide explains why BI projects fail, and how a lean team can sidestep the traps that sink much bigger ones.

Data Analytics Technology, Knowledge Base

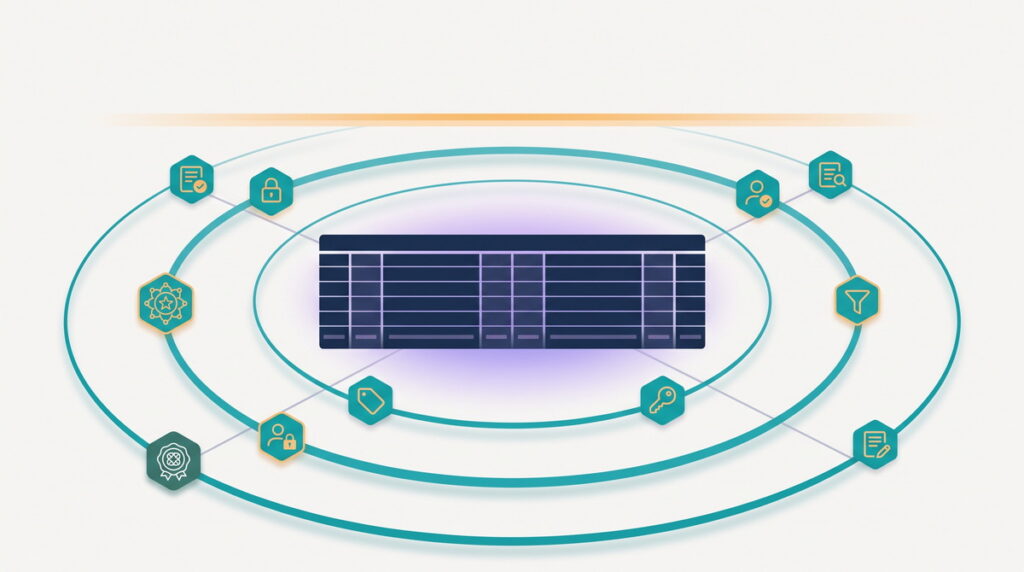
Row-Level Security in Power BI

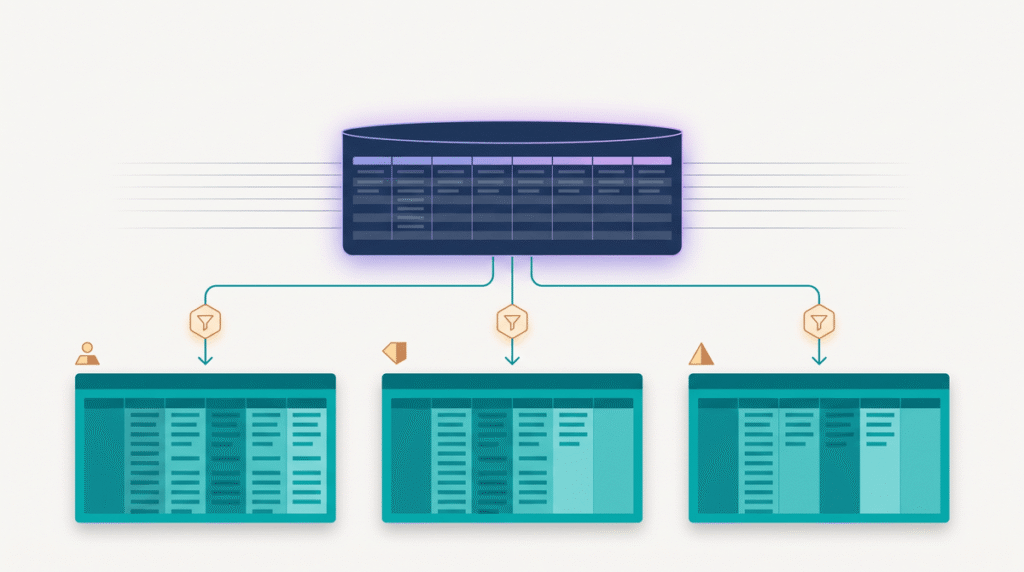
Row-level security, or RLS, is how you make one Power BI report show each person only the rows they’re allowed to see: a regional manager sees their region, a client sees their own account, and nobody sees the whole table unless they should. It’s one of the most useful features in Power BI and one of the easiest to get subtly wrong, in ways that either leak data or block the people who need it. This guide explains what RLS is, how it works, the two ways to build it, the mistakes that bite, and how to get it right the first time.

Data Analytics Technology, Knowledge Base

Power BI Deployment Pipelines

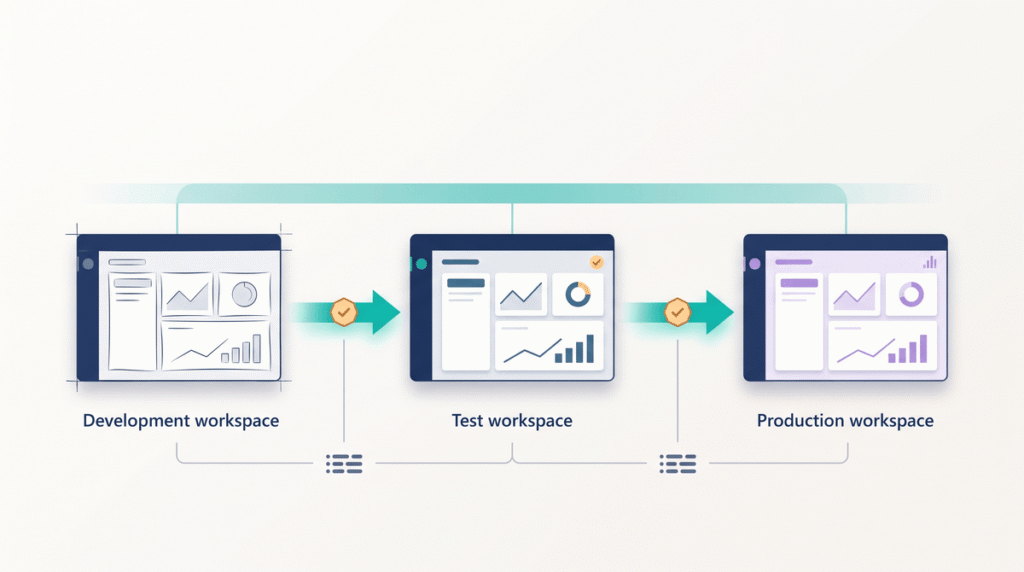
Power BI deployment pipelines are a built-in way to move reports and models through separate development, test, and production environments, so you can ship changes without editing the live report your whole business depends on. If your team builds reports straight in production and holds its breath on every change, deployment pipelines are the fix. This guide explains what they are, how they work, and how to ship reports without breaking production.

Data Analytics Technology, Knowledge Base

What Is OneLake?

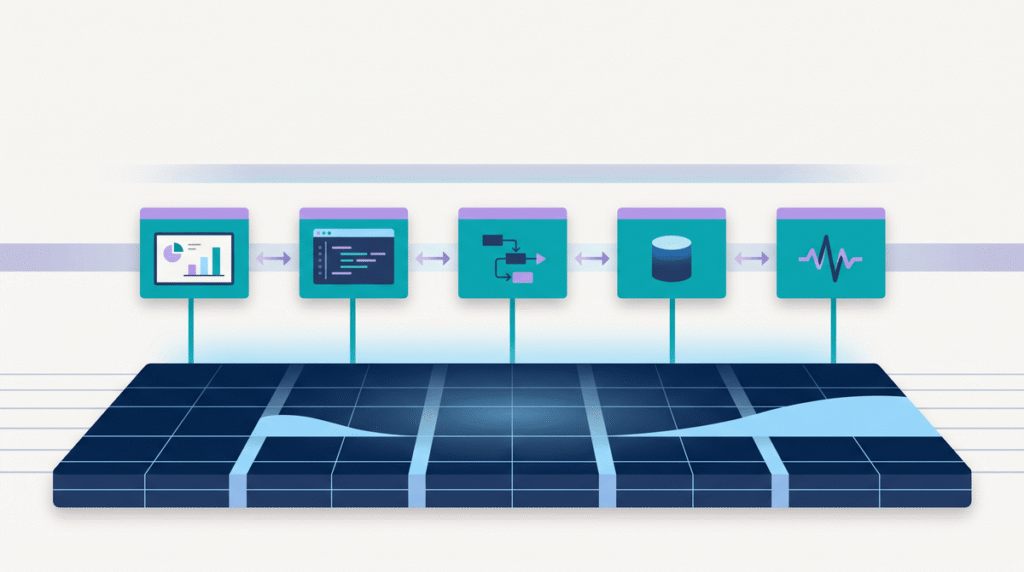
OneLake is Microsoft Fabric’s built-in data lake: a single, organization-wide place where all your data lives, automatically, without your team standing up storage or wiring engines together. If your data is scattered across databases, warehouses, and spreadsheets that never quite agree, OneLake is Fabric’s answer, one lake for the whole business. This guide explains what OneLake is, how it works, and why one lake changes how a company handles data.

Data Analytics Technology, Knowledge Base

Star Schema vs Flat Tables 

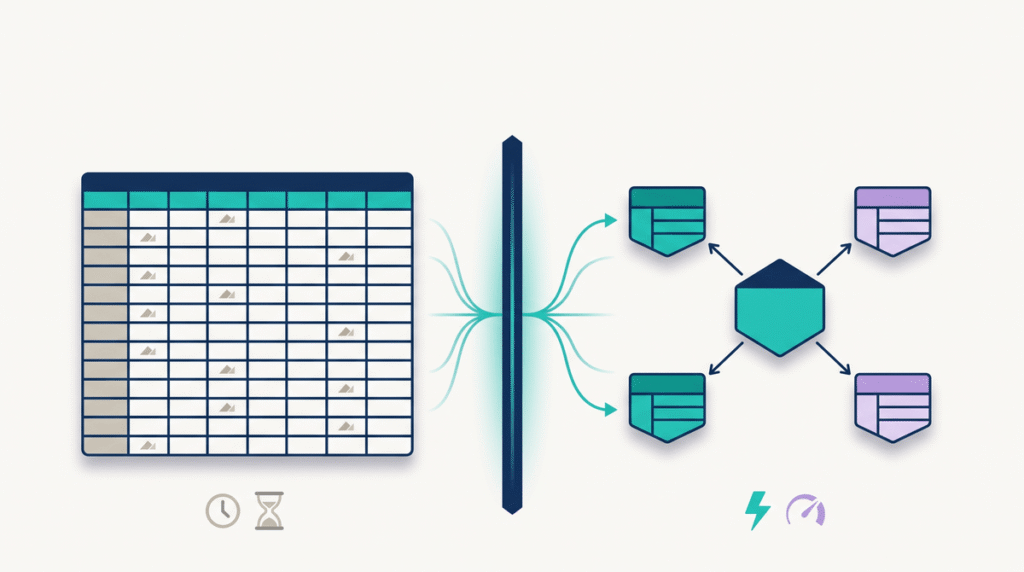
If your Power BI reports are slow, the file is enormous, and your DAX keeps getting more tangled, the shape of your data model is usually to blame. Most slow Power BI models are built as one big flat table when they should be built as a star schema. This guide explains what a star schema is, why flat tables slow Power BI down, and how to fix a model that’s already struggling.

Data Analytics Technology, Knowledge Base

Direct Lake Explained 

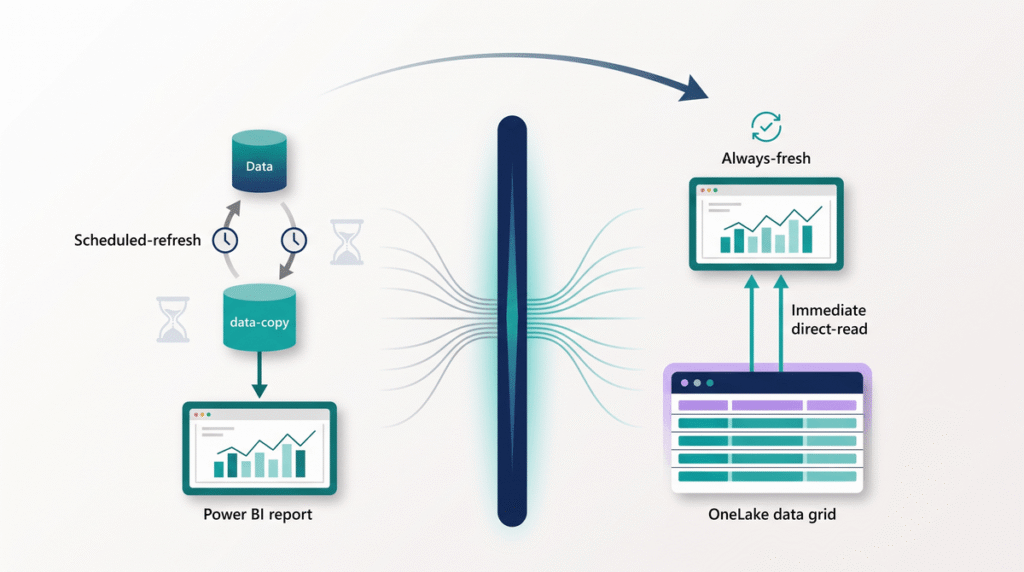
Direct Lake is a Microsoft Fabric feature that lets Power BI read your data straight from storage and return answers at full speed, without the scheduled refresh that Import mode depends on. If your reports are slow to refresh, always a little stale, or prone to breaking overnight, Direct Lake removes that whole class of problem. This guide explains what Direct Lake is, how it works, where it fits, and how to get it right.

Knowledge Base, Data Analytics Technology

AI Readiness Assessment

AI readiness is a plain measure of whether your data is clean, organized, and secure enough for tools like Microsoft 365 Copilot and custom AI agents to use well and safely. Buying the tools is the easy part; the harder question is whether your data is in a state where AI can help rather than embarrass you. This guide explains what AI readiness means, why it matters, and how to tell whether your business is ready.

Data Analytics Technology, Knowledge Base

What Is Microsoft Fabric Copilot? 

Microsoft Fabric Copilot is an AI assistant built into Microsoft Fabric that lets you build reports, write queries, shape data, and explain what’s already there using plain language instead of code. It isn’t one feature in one place; it shows up across every Fabric workload, from Power BI to data pipelines to the warehouse. This guide explains what Fabric Copilot is, what it does in each part of Fabric, what it costs to run, and how to get real value from it rather than a novelty.

Scroll to Top