Power BI and Microsoft Fabric How-To Guides

Data Analytics

Data Analytics Guides

This is the how-to shelf of the Allston Yale knowledge base. When you already know what you want to build and need to do it well, start here: implementation best practices, migration roadmaps, cost and capacity guidance, and industry-specific dashboard guides for the sectors we work in. These are the answers we give clients most often, written down without the sales spin. 

How Much Does It Cost to Migrate to Microsoft Fabric

Determining the total cost of a migration to Microsoft Fabric involves looking at more than...

Migrating Reporting from QlikView or Qlik Sense to Power BI

Migrating from legacy Qlik environments to a modern Microsoft ecosystem requires a calculated strategy centered...

How to Migrate Reporting from Google Looker to Power BI

Migrating your entire reporting infrastructure might feel like trying to build a skyscraper while the...

How to Migrate from SAP BusinessObjects to Power BI Reporting

Migrating from SAP BusinessObjects to Power BI is a strategic move for lean IT teams...

Migrating from Snowflake to Microsoft Fabric

Migrating from Databricks to Microsoft Fabric is essentially a move toward extreme operational simplicity. For...

How to Migrate Reporting from Zoho Analytics to Power BI

Deciding between Microsoft Fabric and Azure SQL requires a clear understanding of their distinct roles...

How to Migrate Your Business from Databricks to Microsoft Fabric

Migrating from Databricks to Microsoft Fabric is essentially a move toward extreme operational simplicity. For...

How Does a Business Migrate from IBM Cognos Analytics to Power BI Reporting

Migrating a lean IT team from IBM Cognos to Power BI requires a strategic shift...

How to Migrate from Amazon QuickSight to Power BI Reporting

Migrating from Amazon QuickSight to Power BI involves a strategic transition of your datasets and...

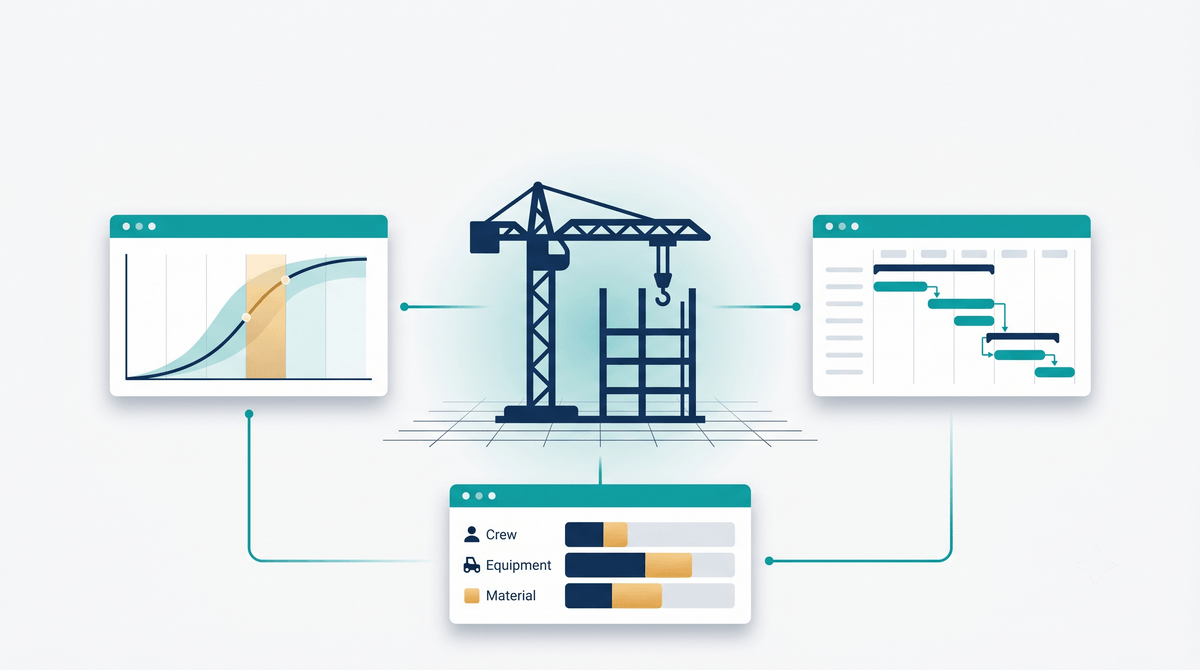
Construction & Engineering Data Analytics: Project Margin and Resource Dashboards 

For American construction and engineering firms, the difference between a profitable project and a margin-eroding...

Insurance Data Analytics: Claims, Underwriting, and Loss-Ratio Dashboards 

American insurance carriers generate enormous volumes of structured data across policy records, claims filings, actuarial...

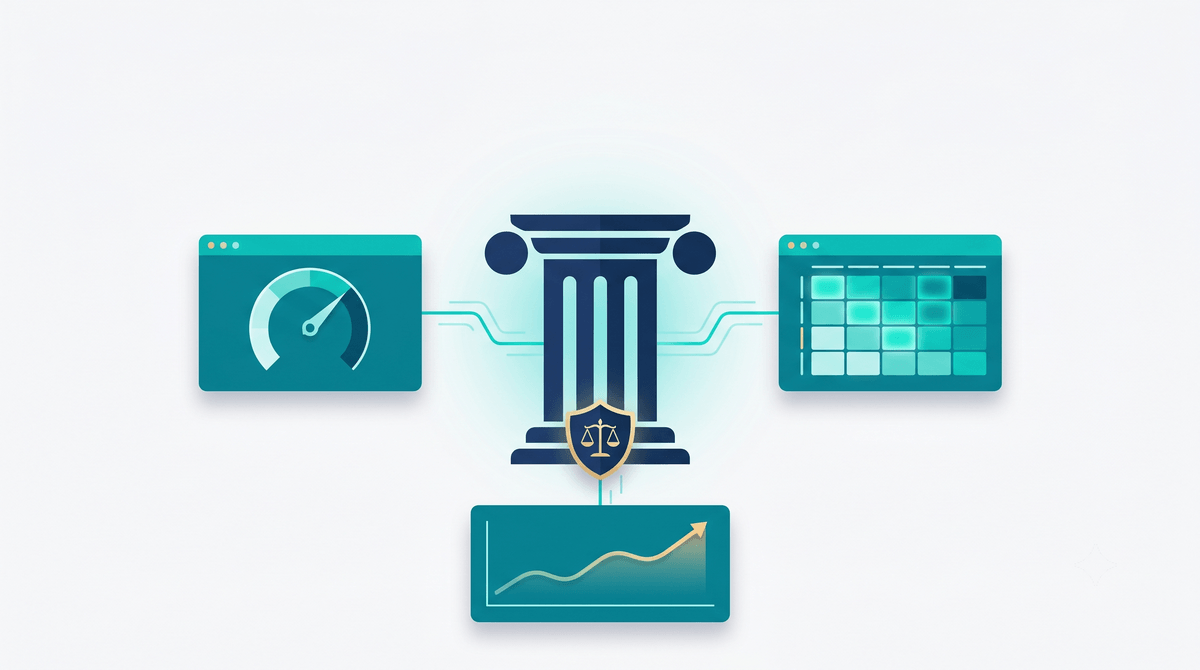
Power BI for Banking and Financial Services: Compliance, Risk, and Profitability Dashboards 

For American banks and financial services firms, the cost of compliance has crossed a threshold...

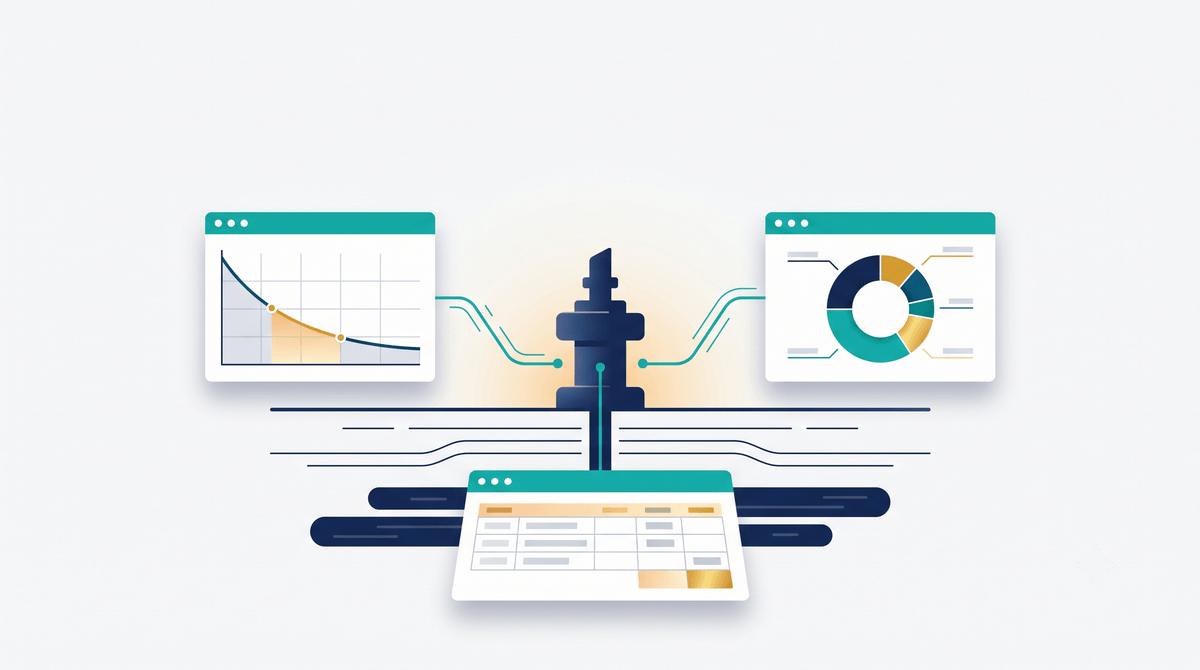
Power BI for Oil and Gas: Production, Lease, and Royalty Reporting 

For American oil and gas operators, production accounting, lease management, and royalty reporting sit at...

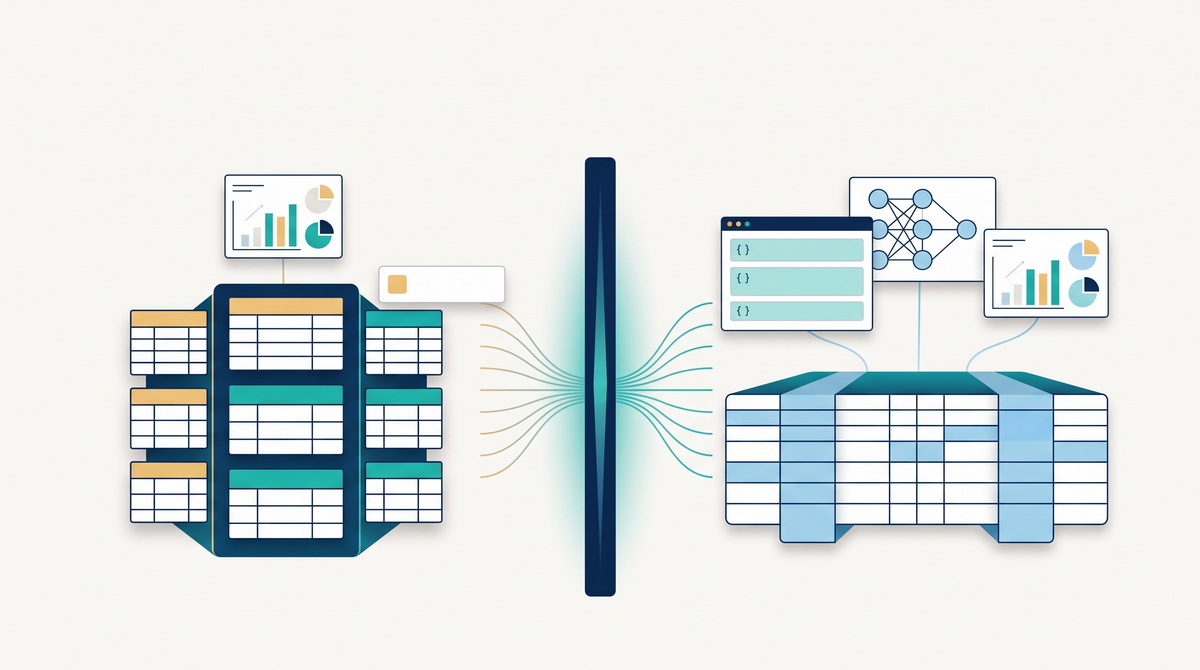
Lakehouse vs Warehouse in Microsoft Fabric 

Microsoft Fabric gives you two ways to store and query structured data: a lakehouse and...

When a Guide Is Not Enough

Guides handle the cases most teams share; yours may be the exception. If part of the work is still a buying decision, the Platform Comparisons shelf covers which tool fits before you build. 

Scroll to Top