Power BI and Microsoft Fabric How-To Guides

Data Analytics

Data Analytics Guides

This is the how-to shelf of the Allston Yale knowledge base. When you already know what you want to build and need to do it well, start here: implementation best practices, migration roadmaps, cost and capacity guidance, and industry-specific dashboard guides for the sectors we work in. These are the answers we give clients most often, written down without the sales spin. 
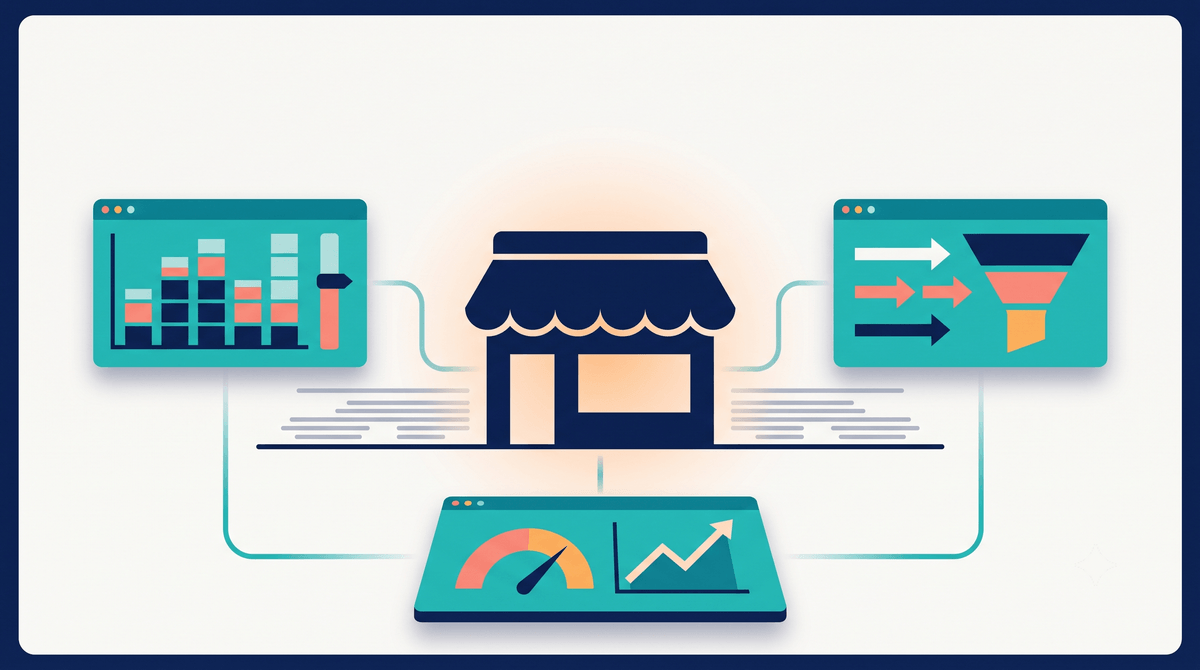
Retail Data Analytics: Inventory, Foot Traffic, and Margin Reporting in Power BI 

For American retailers, the margin between profitable and unprofitable operations has narrowed to single percentage...

Life Sciences Data Analytics: R&D, Clinical, and Compliance Reporting 

For American pharmaceutical, biotech, and medical device companies, data is generated faster than legacy reporting...

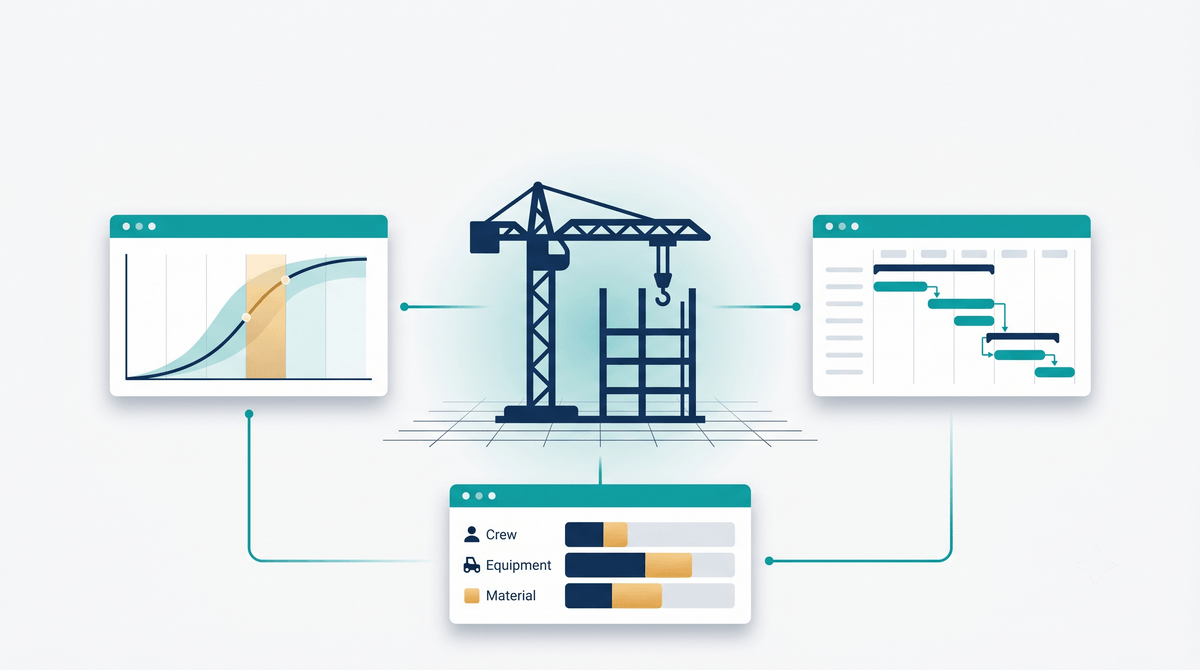
Construction & Engineering Data Analytics: Project Margin and Resource Dashboards 

For American construction and engineering firms, the difference between a profitable project and a margin-eroding...

Insurance Data Analytics: Claims, Underwriting, and Loss-Ratio Dashboards 

American insurance carriers generate enormous volumes of structured data across policy records, claims filings, actuarial...

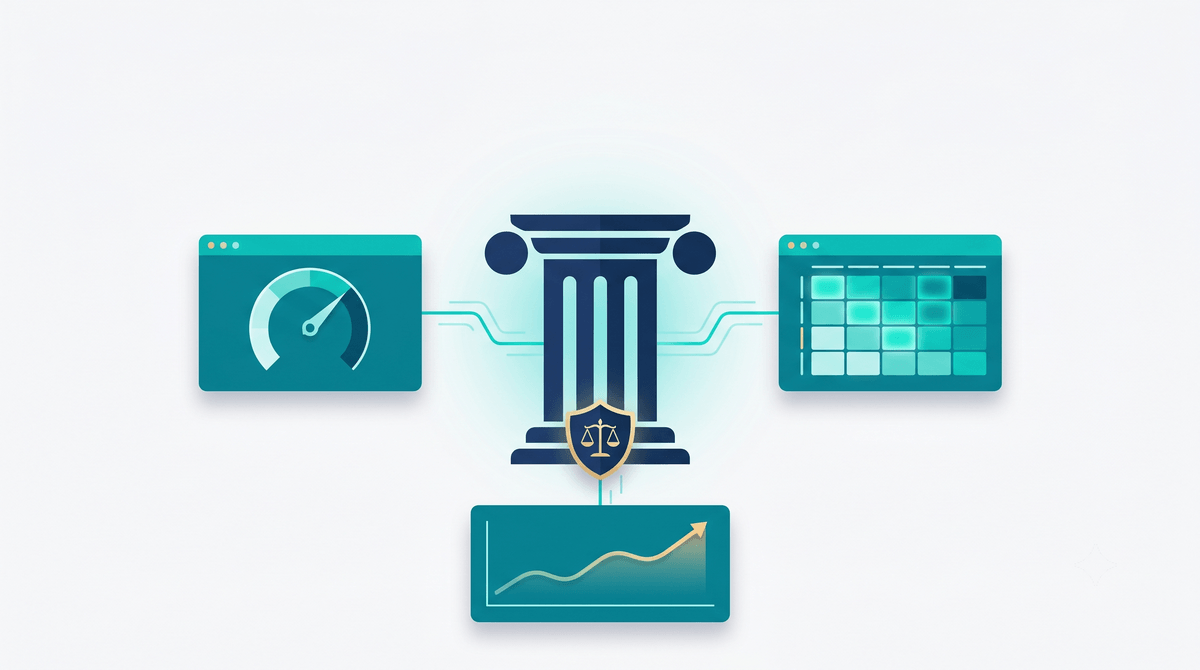
Power BI for Banking and Financial Services: Compliance, Risk, and Profitability Dashboards 

For American banks and financial services firms, the cost of compliance has crossed a threshold...

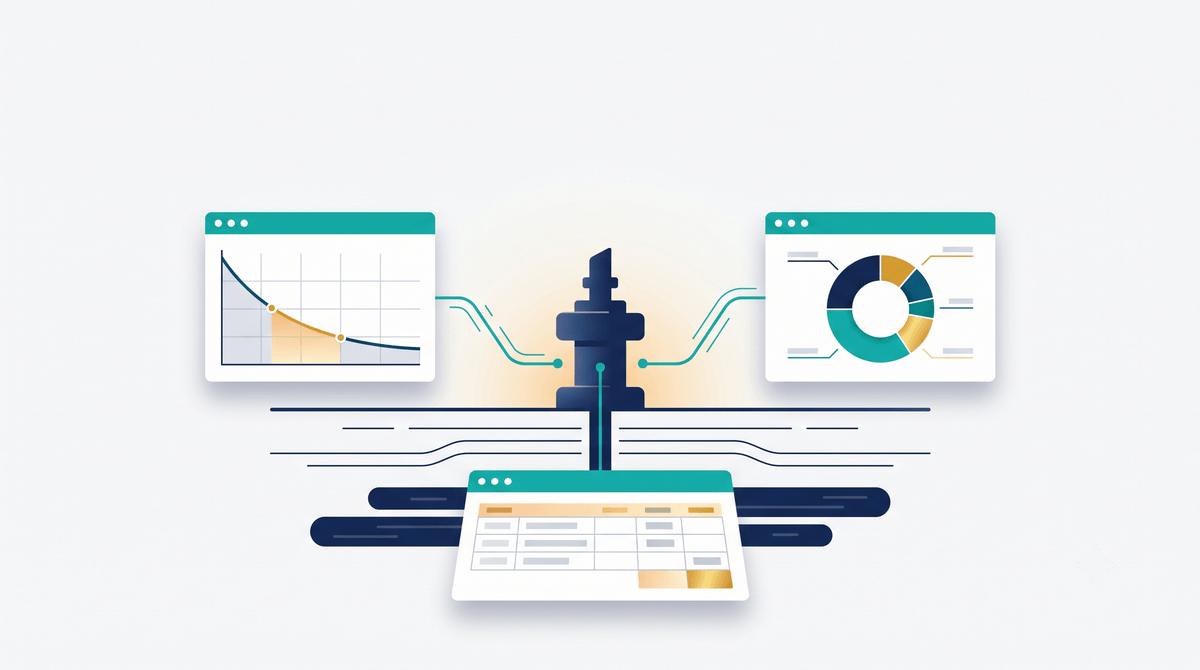
Power BI for Oil and Gas: Production, Lease, and Royalty Reporting 

For American oil and gas operators, production accounting, lease management, and royalty reporting sit at...

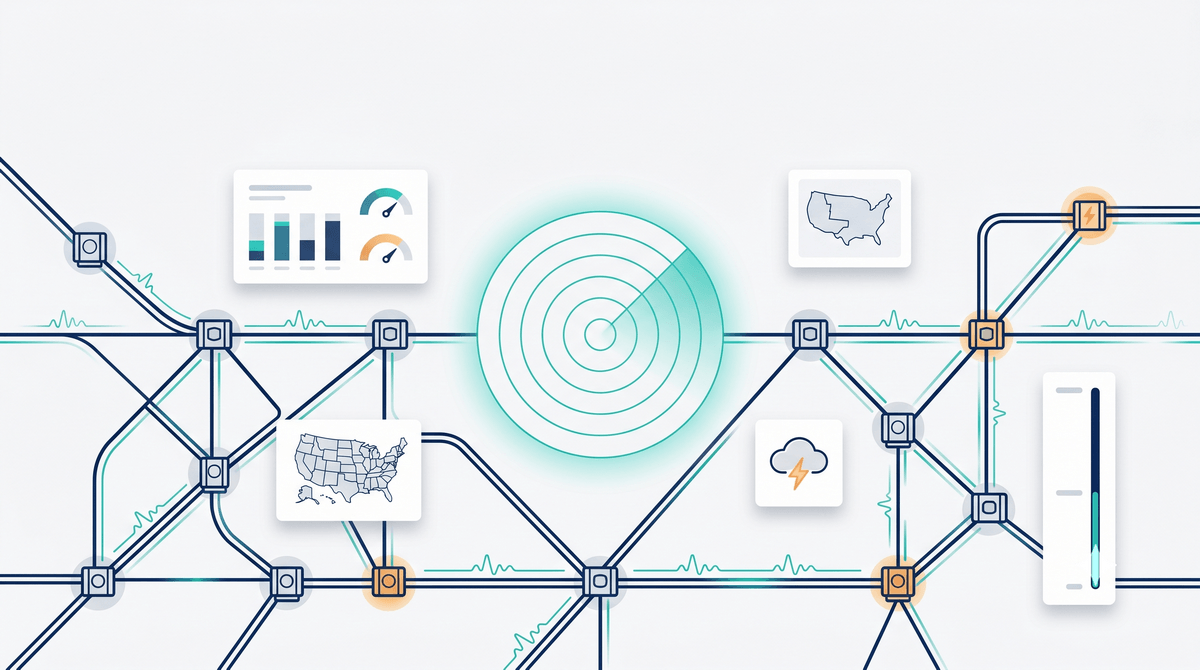
Energy and Utilities Data Analytics: SCADA, Grid, and Outage Reporting 

American utilities operate in a moment where the volume, velocity, and variety of grid data...

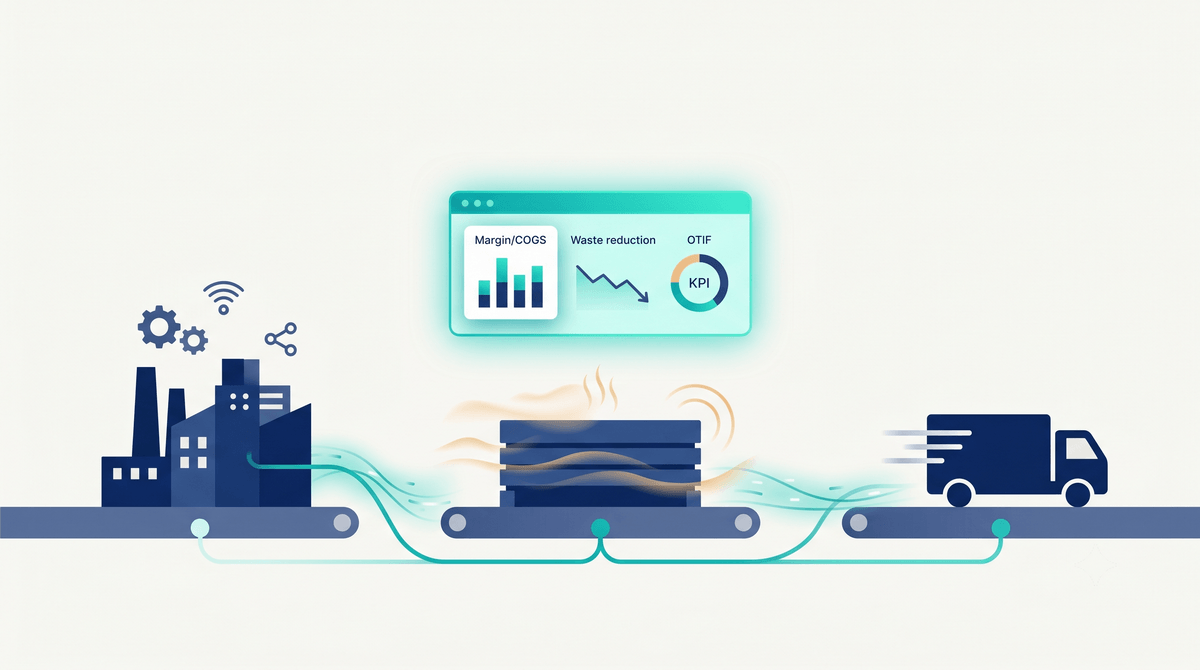
Food & Beverage Analytics: Cost-of-Goods, Waste, and Distribution Reporting 

American food and beverage companies operate on margins that punish every minute of waste, every...

Data Analytics for Manufacturing: OEE, Downtime, and Supply Chain Dashboards 

American manufacturers operating below world-class OEE are leaving capacity on the table that no amount...

Construction & Engineering Data Analytics: Project Margin and Resource Dashboards 

For American construction and engineering firms, the difference between a profitable project and a margin-eroding...

Insurance Data Analytics: Claims, Underwriting, and Loss-Ratio Dashboards 

American insurance carriers generate enormous volumes of structured data across policy records, claims filings, actuarial...

Power BI for Banking and Financial Services: Compliance, Risk, and Profitability Dashboards 

For American banks and financial services firms, the cost of compliance has crossed a threshold...

Power BI for Oil and Gas: Production, Lease, and Royalty Reporting 

For American oil and gas operators, production accounting, lease management, and royalty reporting sit at...

How to Migrate Reporting from Domo to Power BI

Migrating from Domo to Power BI requires a surgical approach focusing on data governance rather...

When a Guide Is Not Enough

Guides handle the cases most teams share; yours may be the exception. If part of the work is still a buying decision, the Platform Comparisons shelf covers which tool fits before you build. 

Scroll to Top