Power BI and Microsoft Fabric How-To Guides
Data Analytics
Data Analytics Guides
This is the how-to shelf of the Allston Yale knowledge base. When you already know what you want to build and need to do it well, start here: implementation best practices, migration roadmaps, cost and capacity guidance, and industry-specific dashboard guides for the sectors we work in. These are the answers we give clients most often, written down without the sales spin.
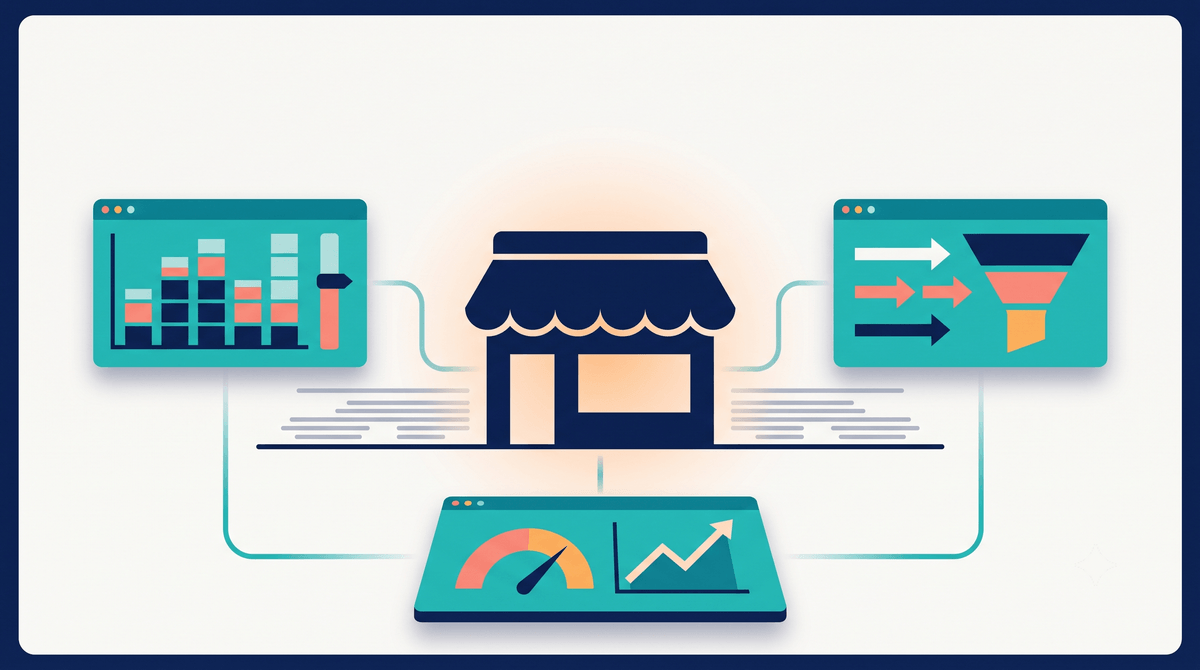
Retail Data Analytics: Inventory, Foot Traffic, and Margin Reporting in Power BI
For American retailers, the margin between profitable and unprofitable operations has narrowed to single percentage...
Life Sciences Data Analytics: R&D, Clinical, and Compliance Reporting
For American pharmaceutical, biotech, and medical device companies, data is generated faster than legacy reporting...
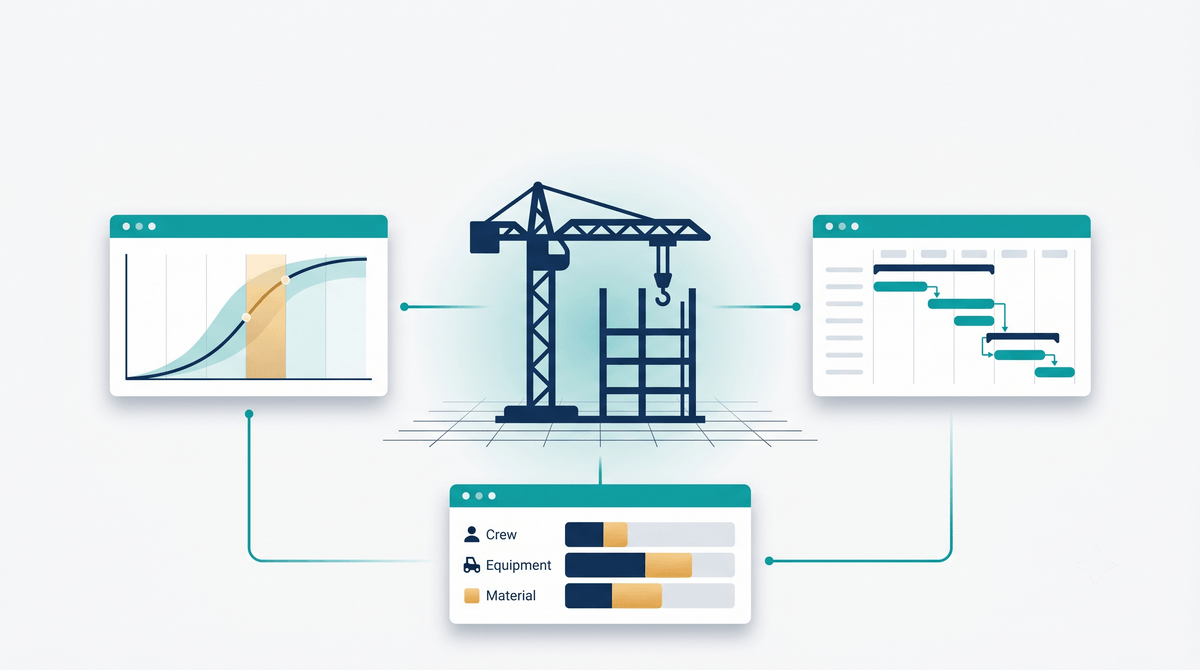
Construction & Engineering Data Analytics: Project Margin and Resource Dashboards
For American construction and engineering firms, the difference between a profitable project and a margin-eroding...
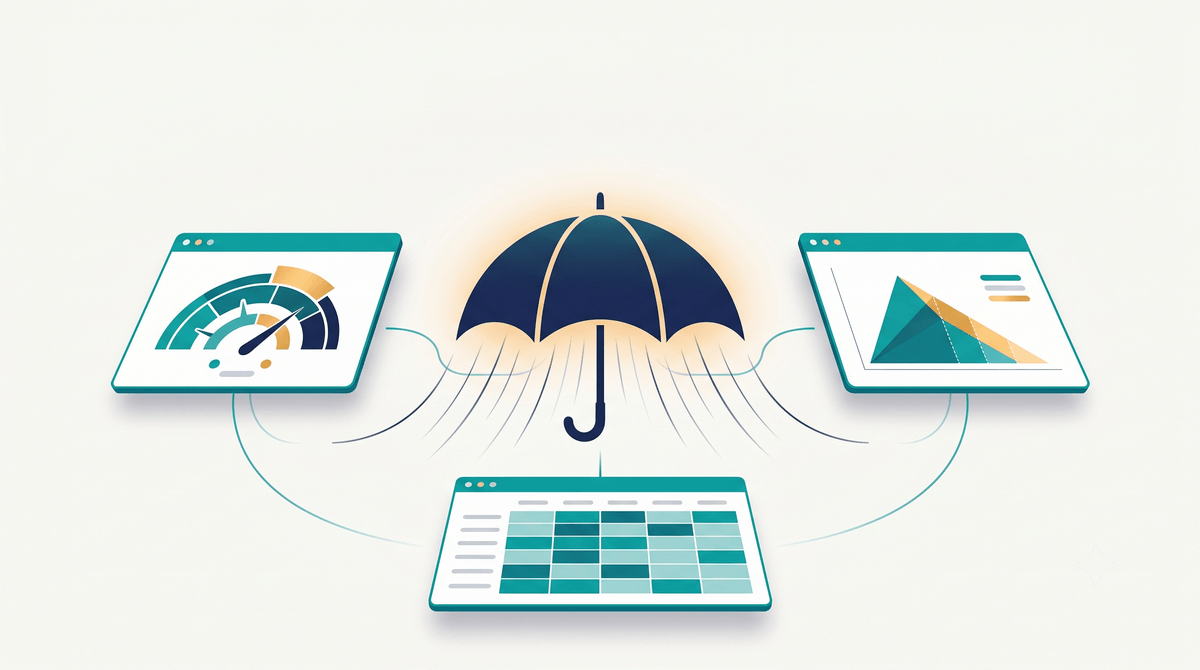
Insurance Data Analytics: Claims, Underwriting, and Loss-Ratio Dashboards
American insurance carriers generate enormous volumes of structured data across policy records, claims filings, actuarial...
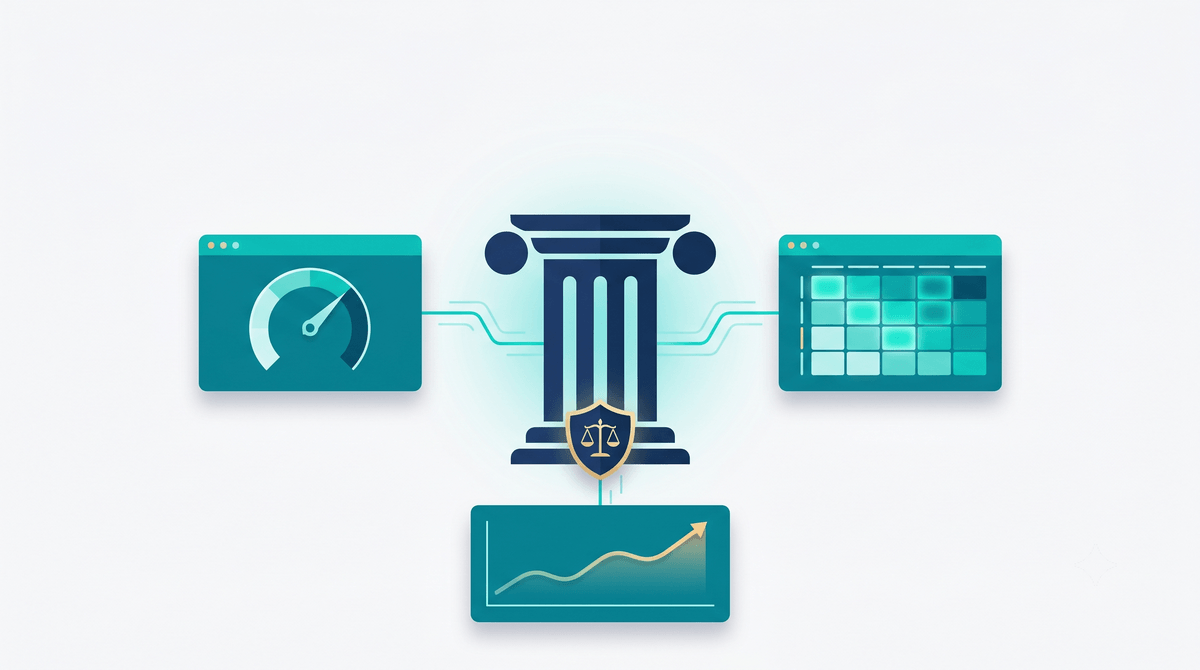
Power BI for Banking and Financial Services: Compliance, Risk, and Profitability Dashboards
For American banks and financial services firms, the cost of compliance has crossed a threshold...
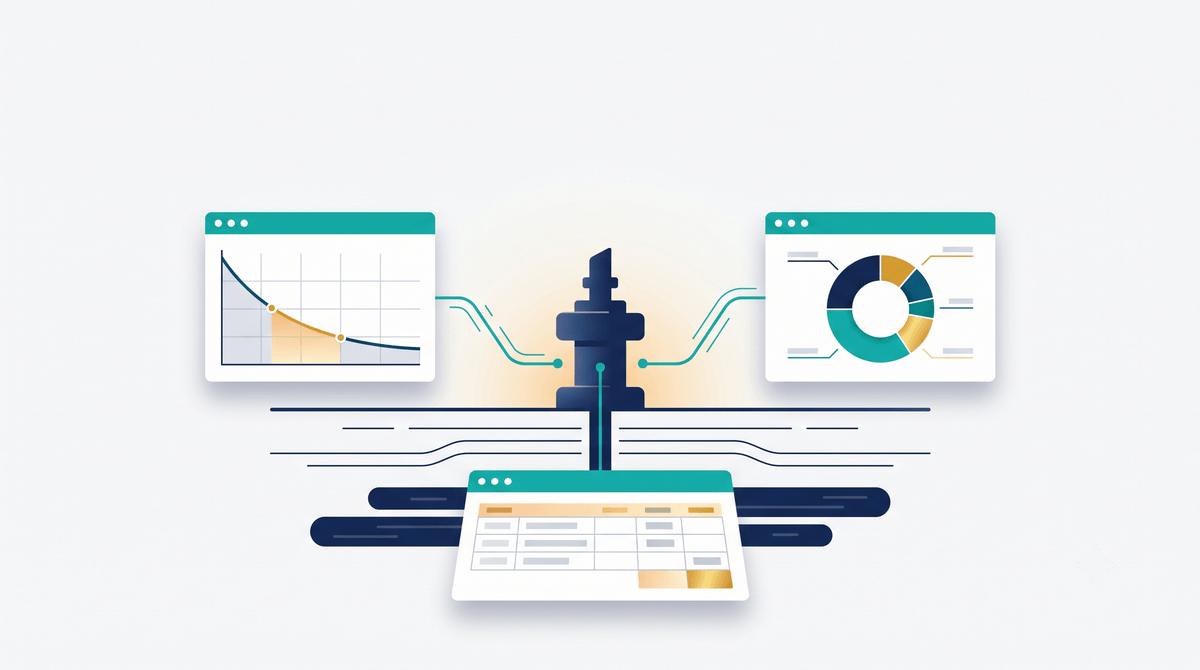
Power BI for Oil and Gas: Production, Lease, and Royalty Reporting
For American oil and gas operators, production accounting, lease management, and royalty reporting sit at...
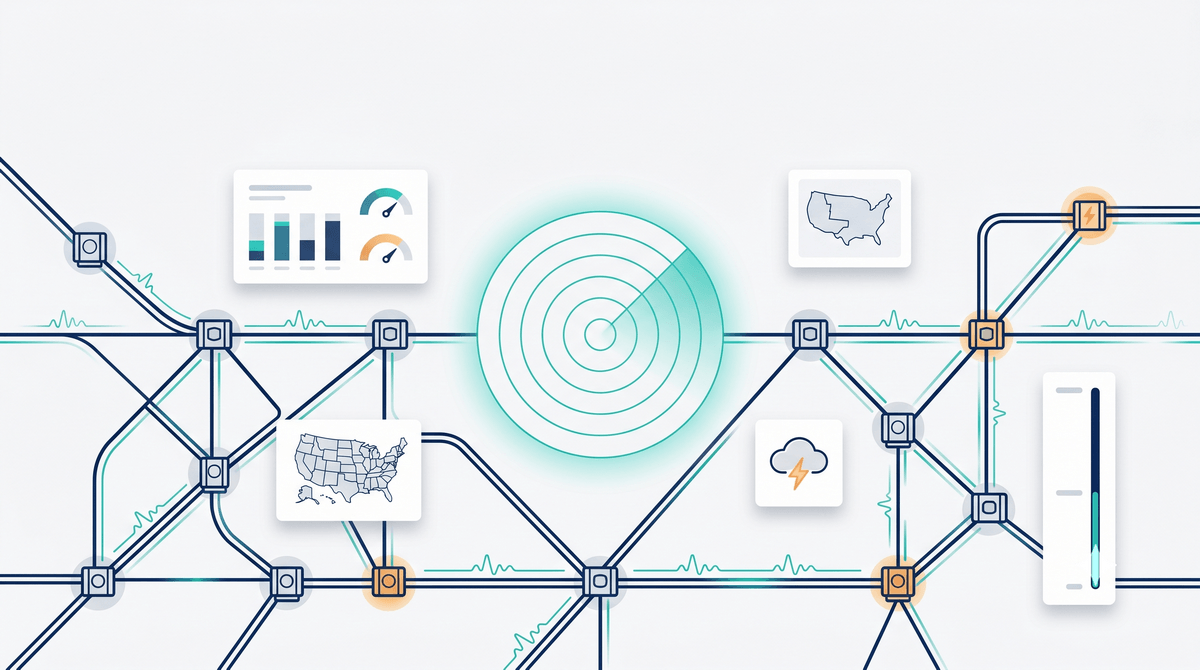
Energy and Utilities Data Analytics: SCADA, Grid, and Outage Reporting
American utilities operate in a moment where the volume, velocity, and variety of grid data...
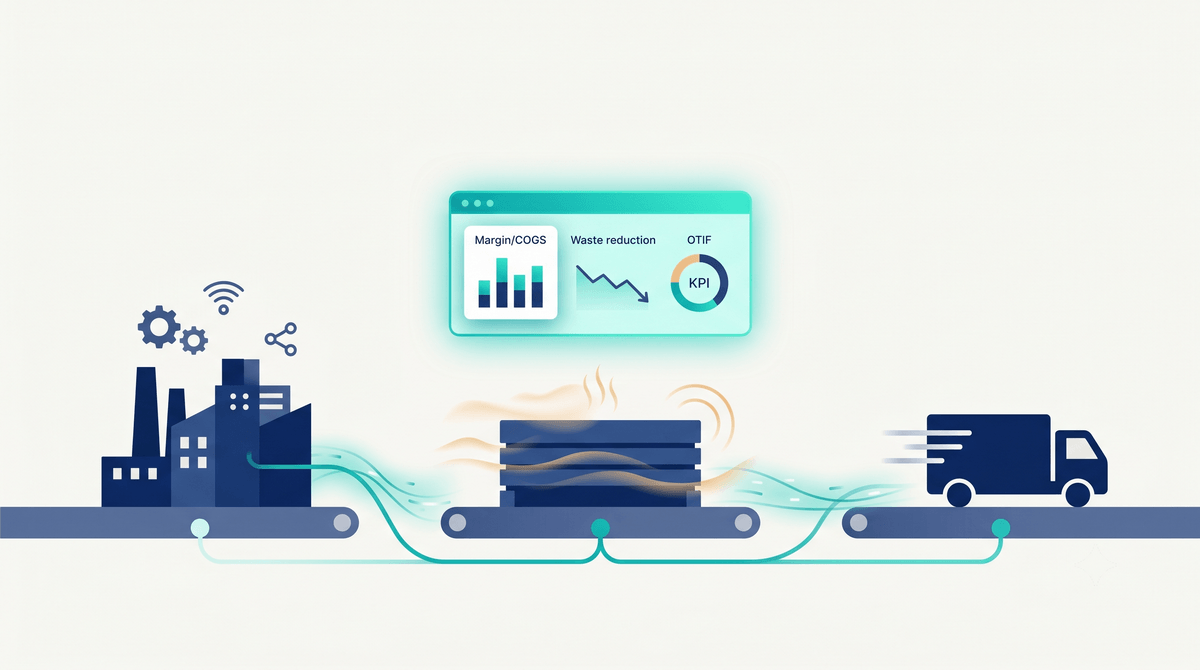
Food & Beverage Analytics: Cost-of-Goods, Waste, and Distribution Reporting
American food and beverage companies operate on margins that punish every minute of waste, every...
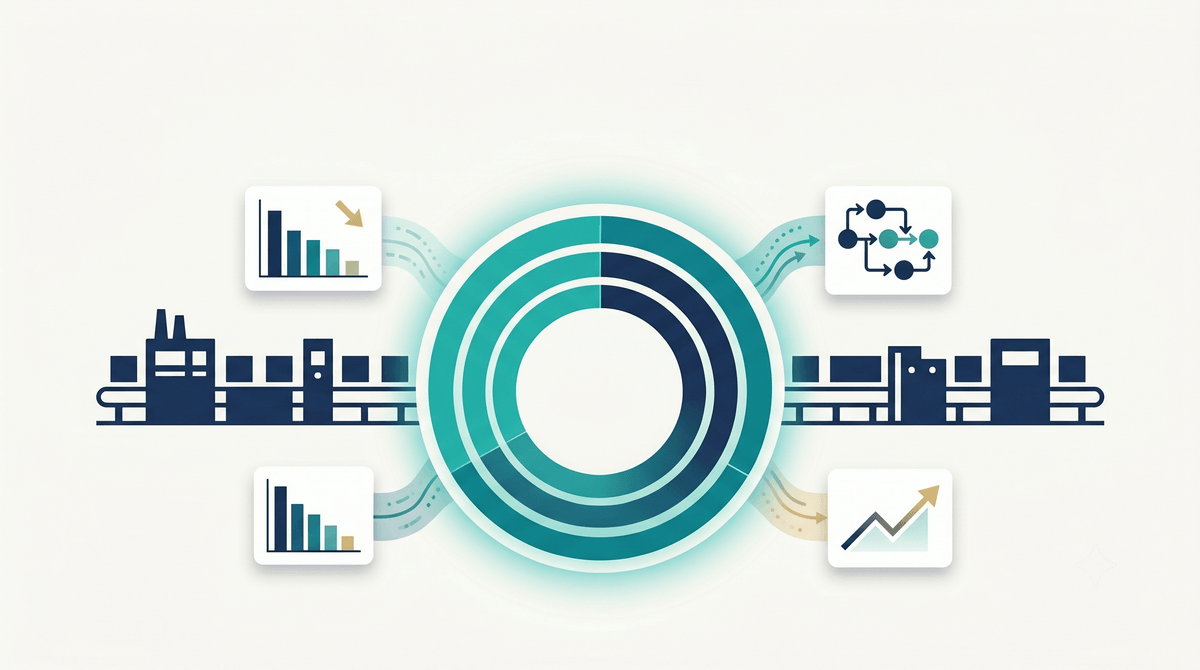
Data Analytics for Manufacturing: OEE, Downtime, and Supply Chain Dashboards
American manufacturers operating below world-class OEE are leaving capacity on the table that no amount...
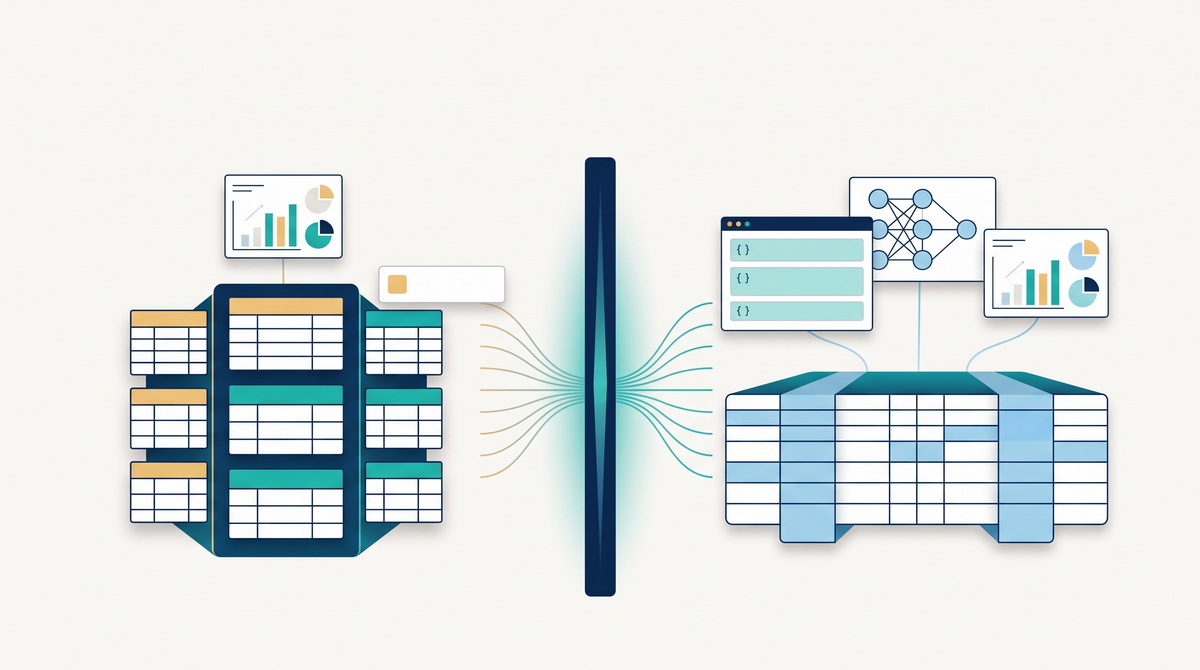
Lakehouse vs Warehouse in Microsoft Fabric
Microsoft Fabric gives you two ways to store and query structured data: a lakehouse and...
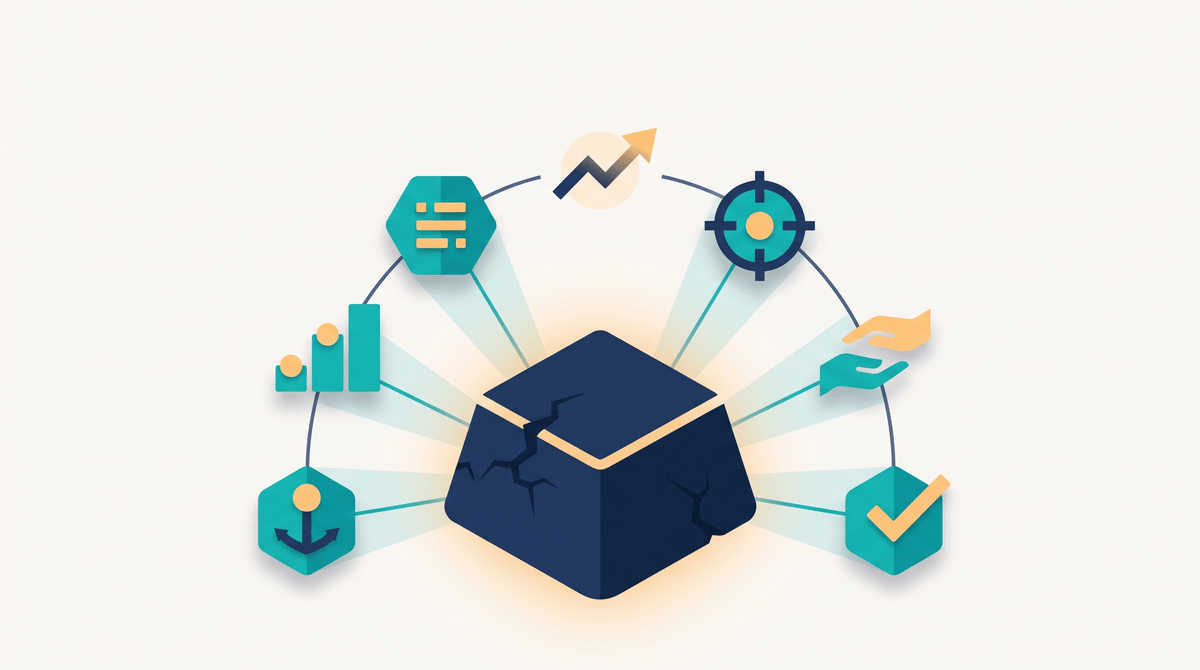
Why BI Projects Fail
Most business intelligence projects don't deliver what they promised. Dashboards get built, launched, and then...
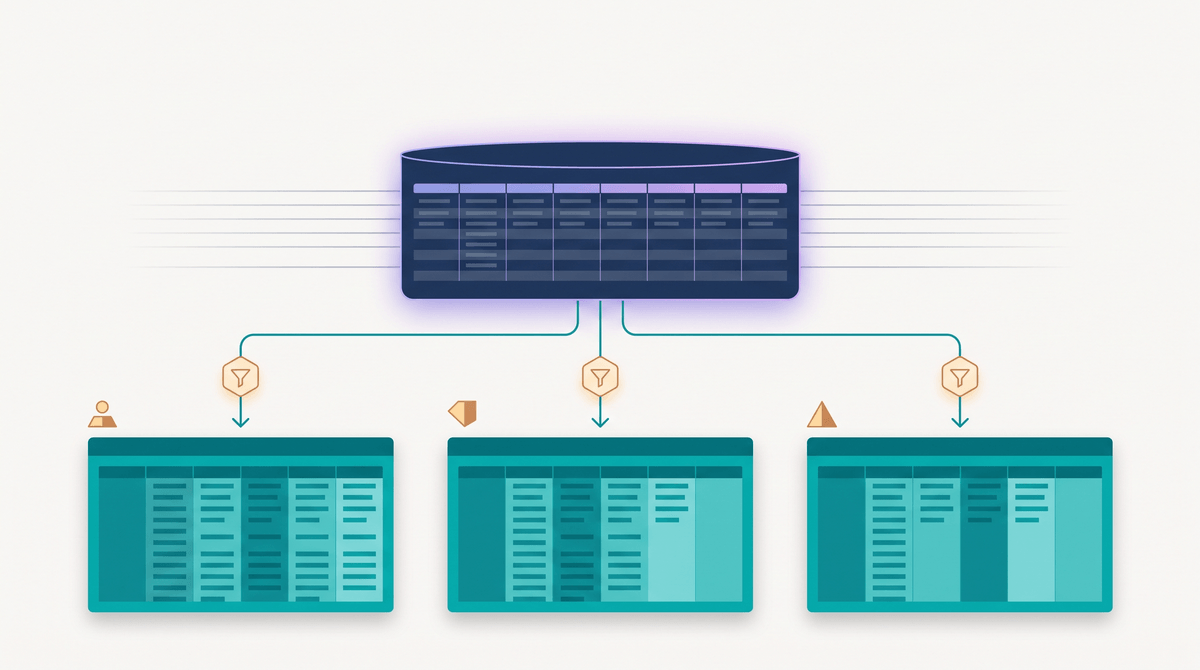
Row-Level Security in Power BI
Row-level security, or RLS, is how you make one Power BI report show each person...
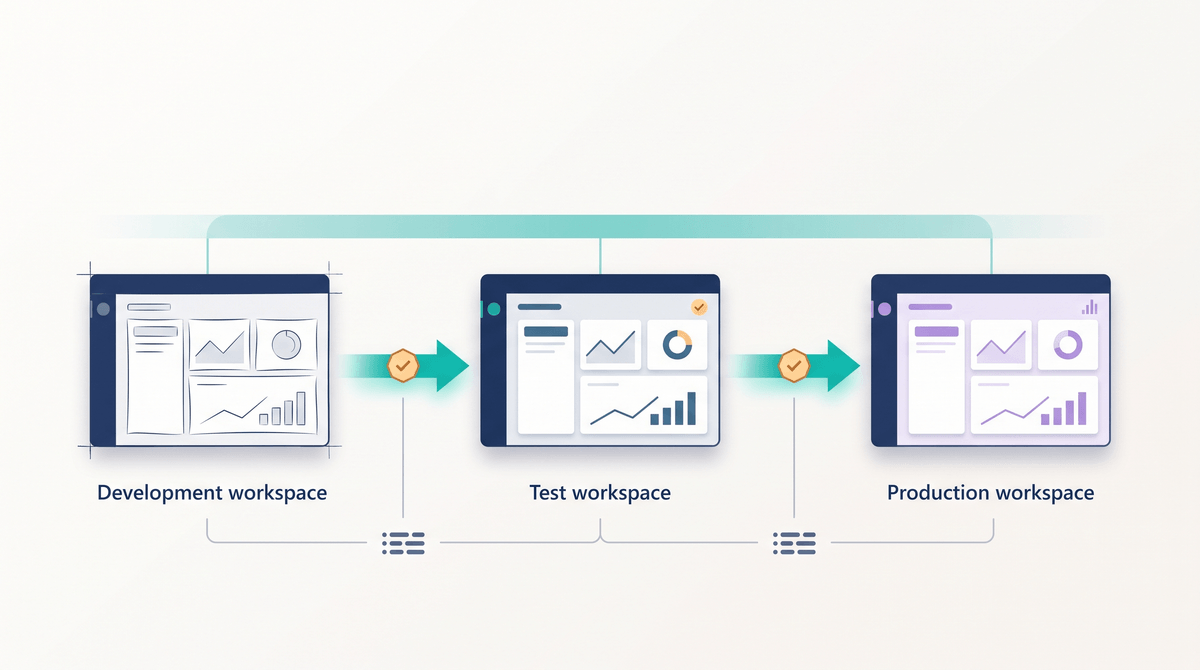
Power BI Deployment Pipelines
Power BI deployment pipelines are a built-in way to move reports and models through separate...
How to Migrate Reporting from Google Looker to Power BI
Migrating your entire reporting infrastructure might feel like trying to build a skyscraper while the...
When a Guide Is Not Enough
Guides handle the cases most teams share; yours may be the exception. If part of the work is still a buying decision, the Platform Comparisons shelf covers which tool fits before you build.